Texas New Home Inventory Reaches New Peak as Sales Soften and Sales Pace Slows
HomesUSA.com reports active listings surge, Days on Market jumps
DALLAS, Nov. 25, 2025 (GLOBE NEWSWIRE) -- New home sales across Texas softened last month, with total sales down 2 percent from September as statewide inventory posted a record high, up nearly 16 percent from October 2024. According to the latest new home sales report from HomesUSA.com and its founder and CEO, Ben Caballero, San Antonio posted a small monthly sales gain.
The HomesUSA.com Texas New Home Sales Report uses Multiple Listing Service data – the most comprehensive, current, and accurate information – from the REALTOR® Associations of North Texas, Houston, Austin, and San Antonio. All averages are based on three-month rolling averages to capture seasonality and remove anomalies.
New home sales across Texas declined in October to 5,430 from 5,564 in September and 5,725 in October 2024. Houston led all markets with 1,975 sales, down from 2,005 the previous month. San Antonio sales posted a monthly increase, rising to 884 from 879.
"What we are seeing in Texas is exactly what I've been predicting, as inventory is up 16 percent with sales down 5 percent year-over-year, but prices holding firm for four straight months," said Ben Caballero, CEO of HomesUSA.com and the nation's top-ranked real estate agent.
"Builders price discipline tells you they aren't panicking. When mortgage rates improve in 2026 – as many economists are predicting – this inventory will help Texas builders be ready for any surge in buyer activity. That interest rate switch can flip faster than most people think,” Caballero added.
Active listings statewide climbed to 37,909 in October, up from 37,323 the previous month. That’s a jump in inventory of over 5,000 additional new homes on the market compared to 32,780 active listings October 2024. Houston continued to lead the state with 16,837 active listings, up from 16,188 in September.
That elevated inventory is contributing to softer forward-looking activity. Pending sales, a measure of future sales in the state’s four largest metros, declined for the fifth straight month to 5,873, down from 6,189 in September. Austin, Dallas-Ft. Worth, and Houston all recorded lower pending sales month-over-month, but San Antonio posted an increase to 881 versus 842.
Average new home prices in Texas overall were flat at $428,309 in October versus $428,433 in September. Year-over-year prices were also flat, posting $428,101 in October 2024.
Austin continues to have the highest average price at $502,332, up from $497,422, while San Antonio remained the most affordable major new homes market at $347,056, down from $358,853 in September.
HomesUSA.com is releasing its Texas New Home Sales Report and New Home Sales Index ahead of the U.S. Commerce Department’s New Residential Sales Report for October, scheduled for Wednesday, November 26, 2025, at 10:00 a.m. Eastern time.
About the Report
The HomesUSA.com monthly report covers closed sales recorded in MLSs by the 10th day of the following month. The report features 3-month moving averages for six essential market data points, including DOM, sales volume, sales prices, sales-to-list price ratio, pending sales, and active listings. We also provide a master chart for the 12-month moving averages for comparison. Caballero explains that the 3-month moving average indices track market seasonality, while the 12-month moving average removes seasonality and tracks the longer trend.
DAYS ON MARKET: Sales pace slows statewide
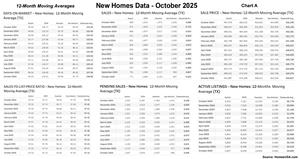
Days on Market increased in across Texas in every market but San Antonio, with the statewide DOM reaching 112.63 days compared to 109.63 in September, indicating a slowing sales pace. Dallas-Fort Worth experienced the most significant deterioration, jumping to 150.25 days from 141.85. Houston continued as the fastest-moving market at 89.04 days, though up slightly from 88.65. Austin’s sales pace slowed slightly to 96.32 days from 95.19. In contrast, San Antonio’s sales pace sped up to 94.94 days from 96.44. The statewide DOM shows a substantial 15 percent increase from 97.99 days in October 2024, signaling continued market cooling.
Note: New homes typically spend more time on the market than existing homes because many are listed while still under construction. Each MLS may calculate DOM differently, so direct comparisons may not always be reliable. (See Chart 1: Texas New Homes Days on Market)
NEW HOME SALES: Soften in October
October new home sales in Texas continued their downward trend, with the 3-month moving average falling to 5,430 from 5,564 in September – a decline of just over 2 percent. Year-over-year, sales dropped 5 percent from 5,725 last October. Houston maintained its position as the leading market with 1,975 sales, though down from 2,005 the previous month. Dallas-Fort Worth new home sales decreased to 1,922 from 1,981, with Austin new home sales also dropping to 649 from 699. San Antonio posted the only monthly gain among major metros, rising to 884 from 879. (See Chart 2: Texas New Home Sales)
NEW HOME PRICES: Remain flat
Average new home prices in Texas overall were flat at $428,309 in October versus $428,433 in September. Year-over-year prices were also flat, posting $428,101 in October 2024. Dallas-Fort Worth’s average price jumped to $467,986 from $461,488 in September. Austin continues to have the highest average price at $502,332 from $497,422, while San Antonio remained the most affordable major new homes market at $347,056, down from $358,853 in September. Houston’s average home price also slightly decreased to $401,477 in October from $402,327 in September. (See Chart 3: Texas New Home Prices)
SALES-TO-LIST PRICE RATIO: Continues to slip
The statewide sales-to-list price ratio for new homes declined slightly in October. The statewide average slipped to 96.55 percent, down from 96.70 percent in September. Dallas-Fort Worth posted a ratio of 97.45 percent, slightly down from 97.55 percent in September. Austin recorded 97.11 percent, down from 97.20 percent, its fifth straight monthly drop. Houston's ratio dropped to 95.60 percent from 95.77 percent, also down for the fifth straight month in a row. San Antonio's average dropped to 96.39 percent from 96.62 percent, declining for the eighth month in a row. (See Chart 4: Texas Sales-to-List Price Ratio)
PENDING SALES: Demand continues to weaken
Pending sales continues into its fifth month of decline at 5,873, down from 6,189 in September – more than a 5 percent drop. This represents more than a 11 percent year-over-year decline from 6,572 in October 2024. Dallas-Fort Worth has the most pending sales activity with 2,321 sales, still down slightly from 2,385 in September. Houston dropped to 1,761 pending sales from 1,990, while Austin declined sharply to 910 from 972, suggesting further sales weakness ahead. San Antonio was the exception, posting an increase in pending sales in October at 881, up from 842 in September. (See Chart 5: Texas Pending New Home Sales)
ACTIVE LISTINGS: Inventory reaches a new high
New home inventory continues to post record highs with 37,909 active listings in October, up from 37,323 in September. This marks more than a 16 percent surge from 32,780 listings in October 2024. Houston continues to dominate inventory levels with 16,837 active listings, up from 16,188. Dallas-Fort Worth’s inventory slightly rose to 9,259 from 9,227, while San Antonio's inventory swelled to 5,911 listings from 5,863. Austin was the anomaly, as active listings decreased to 5,903 in October from 6,045 in September. (See Chart 6: Texas Active Listings)
About the HomesUSA.com New Home Sales Index
The HomesUSA.com New Home Sales Index is reported as both a 3-month and 12-month moving average of the Days on Market for new homes listed in the local Multiple Listing Services (MLSs) for Dallas-Ft. Worth, Houston, Austin, and San Antonio. Created by Ben Caballero in December 2017, it is the first Days on Market index to track the Texas new home market based on activity in its largest markets and includes homes listed while under construction. (See Chart A: 12-Month Moving Averages)
About Ben Caballero and HomesUSA.com®
Ben Caballero, founder and CEO of HomesUSA.com, is a three-time Guinness World Records title holder for “Most annual home sale transactions through MLS by an individual sell-side real estate agent – current.” Ranked by REAL Trends as America’s top real estate agent for home sales since 2013, Ben is the most productive real estate agent in U.S. history.
He is the only individual real estate agent to reach nearly $4 billion in residential sales transactions in a single year ($3.93 billion in 2024), the first agent to exceed $3 billion (2022), the first to exceed $2 billion (2018–2020), and the first to exceed $1 billion (2015–2017). An award-winning innovator and technology pioneer, Ben works with more than 70 home builders in Dallas-Fort Worth, Houston, Austin, and San Antonio. Ben’s podcast series is available widely, including Apple Podcasts, Spotify, and YouTube. Learn more at HomesUSA.com | Twitter: @bcaballero - @HomesUSA | Facebook: /HomesUSAdotcom.
Note for journalists: You may contact Ben Caballero directly by email at ben@homesusa.com.
REALTOR® is a federally registered collective membership mark which identifies a real estate professional who is a member of the NATIONAL ASSOCIATION OF REALTORS® and subscribes to its strict Code of Ethics.
Media Contact:
Kevin Hawkins
(206) 866-1220
kevin@wavgroup.com
Image: Ben Caballero
https://bit.ly/ben-caballero-photo
Individual Chart images:
Chart 1: Days on Market – Thru Oct. 2025: https://homesusa.com/wp-content/uploads/2025/11/Chart-1-Texas-New-Homes-Tracking-Days-on-Market.png
Chart 2: New Home Sales – Thru Oct. 2025: https://homesusa.com/wp-content/uploads/2025/11/Chart-2-Texas-New-Home-Sales-Market.png
Chart 3: Sales Prices – Thru Oct. 2025: https://homesusa.com/wp-content/uploads/2025/11/Chart-3-Texas-New-Home-Sales-Prices-Market.png
Chart 4: Sales-to-List-Price Ratio – Thru Oct. 2025: https://homesusa.com/wp-content/uploads/2025/11/Chart-4-Texas-Sales-to-List-Price-Ratio-Market.png
Chart 5: Pending New Home Sales – Thru Oct. 2025: https://homesusa.com/wp-content/uploads/2025/11/Chart-5-Texas-Pending-New-Home-Sales-Market.png
Chart 6: Active Listings – Thru Oct. 2025: https://homesusa.com/wp-content/uploads/2025/11/Chart-6-Texas-Active-Listings-for-New-Homes-Market.png
Chart A: 12-Month Moving Averages – Thru Oct. 2025: https://homesusa.com/wp-content/uploads/2025/11/Chart-A-12MonthChart-DataOnly.jpg

![]()
Ben Caballero, founder and CEO of HomesUSA.com

Ben Caballero, founder and CEO of HomesUSA.com, is a three-time Guinness World Records title holder and ranked by RealTrends as America’s top real estate agent for home sales since 2013. Ben is the most productive real estate agent in U.S. history and is the only individual real estate agent to reach nearly $4 billion in residential sales transactions in a single year ($3.93 billion in 2024).
DAYS ON MARKET: Sales pace of new homes slows in Texas
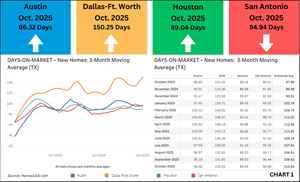
Days on Market increased in across Texas in every market but San Antonio, with the statewide DOM reaching 112.63 days compared to 109.63 in September, indicating a slowing sales pace.
Texas New Homes Inventory Reaches a New High
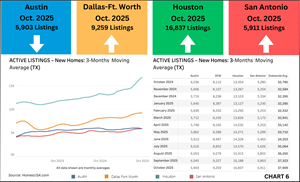
New home inventory continues to post record highs with 37,909 active listings in October, up from 37,323 in September. This marks more than a 16 percent surge from 32,780 listings in October 2024.
Texas New Home Prices Remain Flat Last Month
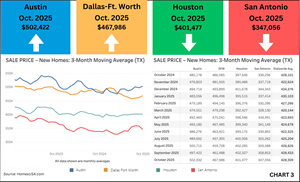
Average new home prices in Texas overall were flat at $428,309 in October versus $428,433 in September. Year-over-year prices were also flat, posting $428,101 in October 2024.
Texas New Home Sales Soften in October
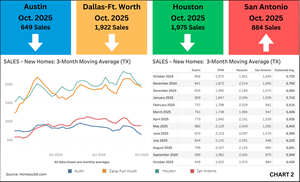
October new home sales in Texas continued their downward trend, with the 3-month moving average falling to 5,430 from 5,564 in September – a decline of just over 2 percent. Year-over-year, sales dropped 5 percent from 5,725 last October.
12-Month Trends of Texas New Homes Data
The HomesUSA.com Texas New Home Sales Report includes 12-month moving averages of home sales, prices, price-to-list ratios, pending sales and active sales. While the 3-month moving average indices track market seasonality, the 12-month moving average removes the seasonality and tracks the longer trend.
Pending Sales of New Homes in Texas Continues to Weaken
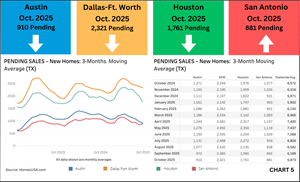
Pending sales continues into its fifth month of decline at 5,873, down from 6,189 in September – more than a 5 percent drop. This represents more than a 11 percent year-over-year decline from 6,572 in October 2024.
Texas “Sales-to-List” Price Ratio for New Homes Continues to Slip
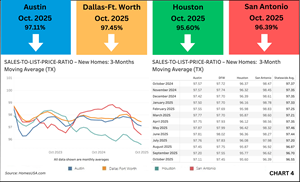
The statewide sales-to-list price ratio for new homes declined slightly in October. The statewide average slipped to 96.55 percent, down from 96.70 percent in September.
Legal Disclaimer:
EIN Presswire provides this news content "as is" without warranty of any kind. We do not accept any responsibility or liability for the accuracy, content, images, videos, licenses, completeness, legality, or reliability of the information contained in this article. If you have any complaints or copyright issues related to this article, kindly contact the author above.
